The United States of Beer
The United States of America is a diverse and highly unique country. We often see sharp differences from one state to another (ahem, Red v Blue), and it is no different when looked at through beer goggles.
Craft beer started its meteoric rise in popularity in the early 2000’s, and that trend has continued though the COVID pandemic we currently find ourselves in. If beer drinking is our national pastime, then home brewing is its foundation.
Here we look at some craft beer statistics to see where the trends lay and which states stand out from others.
Breweries Per Capita
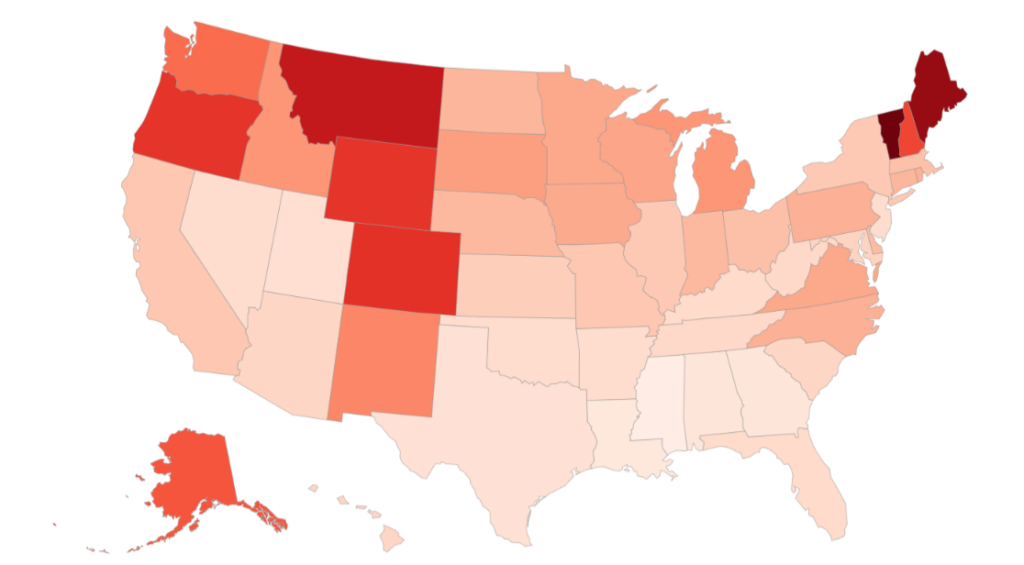
In this map, we look at the number of breweries in each state when compared to the number of residents. The North-Northeast has the highest concentration of breweries per capita (per 100,000 residents), followed closely by the Pacific Northwest. Most of the states in the deep red are those with low total populations. Vermont, Maine and Montana are all in the bottom ten states in terms of population. The fact that the Pacific Northwest is the hop epicenter of the US also adds to their likelihood of having a lot of breweries.
Top Five States
| State | Breweries PC |
|---|---|
| Vermont | 10.8 |
| Maine | 9.9 |
| Montana | 8.5 |
| Colorado | 7.3 |
| Oregon | 7.2 |
Bottom Five States
| State | Breweries PC |
|---|---|
| Mississippi | 0.5 |
| Louisiana | 0.9 |
| Georgia | 1.0 |
| Alabama | 1.0 |
| Texas | 1.2 |
Density of Breweries
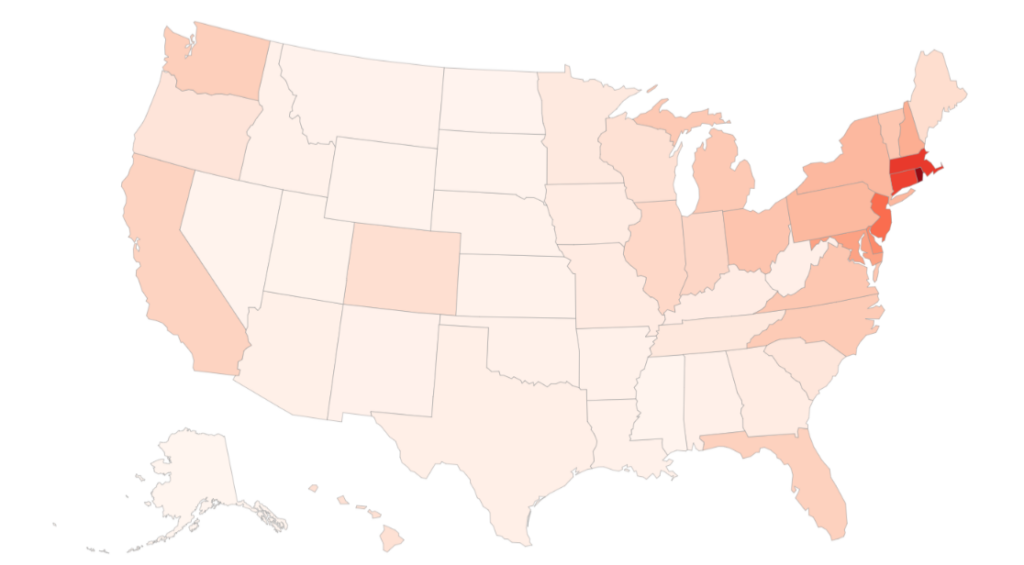
In this map we compare the number of breweries with the amount of land square footage in each state. Here you can see that the Northeast US has the highest concentration of breweries. Apparently we also need to throw DC into this mix as well, but that’s probably due to the fact that politicians love their alcohol.
The breweries that launched the New England IPA style are from this region. The Alchemist started the craze with their preeminent Heady Topper Double IPA. Following their lead, Hill Farmstead, Trillium, Treehouse, Other Half and others all began expanding on the new style. Before long creamy, hazy beers flipped from being referred to as “gross bathwater” to “juicy”.
Top Five States
| State | Brewery Density |
|---|---|
| District of Columbia | 174.5 |
| Rhode Island | 31.9 |
| Massachusetts | 22.3 |
| Connecticut | 21.5 |
| New Jersey | 17.1 |
Bottom Five States
| State | Brewery Density |
|---|---|
| Alaska | 0.078 |
| Mississippi | 0.298 |
| North Dakota | 0.319 |
| Nevada | 0.410 |
| Wyoming | 0.422 |
Brewery Growth Rate
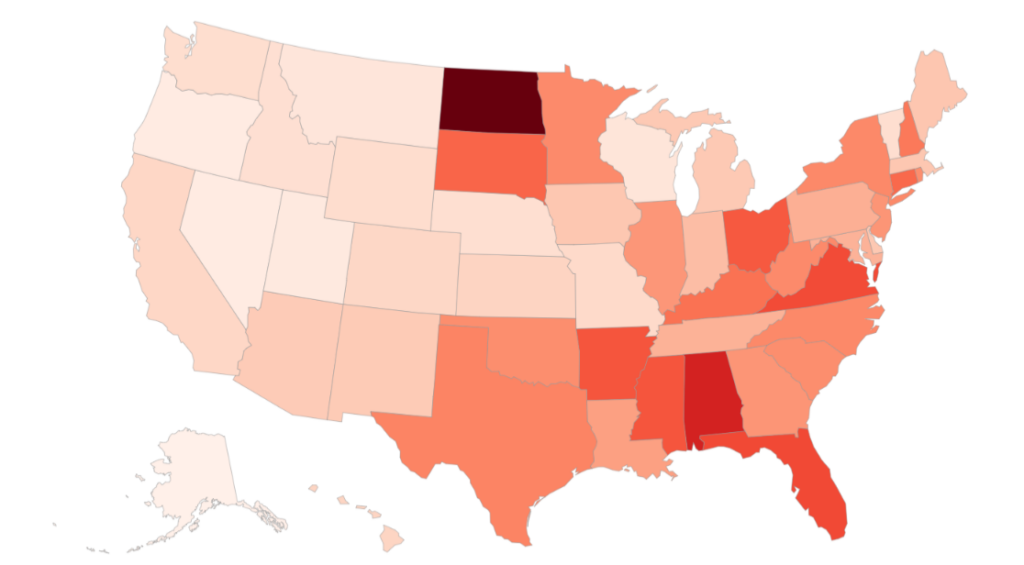
This is an interesting map, as it is almost the mirror opposite of the Breweries Per Capita layout. In the nine years elapsed between 2011 and 2019, the US’s count of breweries grew 315%. Most of the growth was seen in areas of the country where there had not been many breweries to begin with. North Dakota and Alabama only respectively had 2 and 6 craft breweries in 2011. With totals that small, even a modest increase would result in a huge growth rate.
Top Five States
| State | Growth % |
|---|---|
| North Dakota | 1000% |
| Alabama | 750% |
| Florida | 631% |
| Virginia | 625% |
| Arkansas | 600% |
Bottom Five States
| State | Growth % |
|---|---|
| District of Columbia | 100% |
| Alaska | 125% |
| Nevada | 150% |
| Oregon | 151% |
| Utah | 163% |
Brewery Production Levels
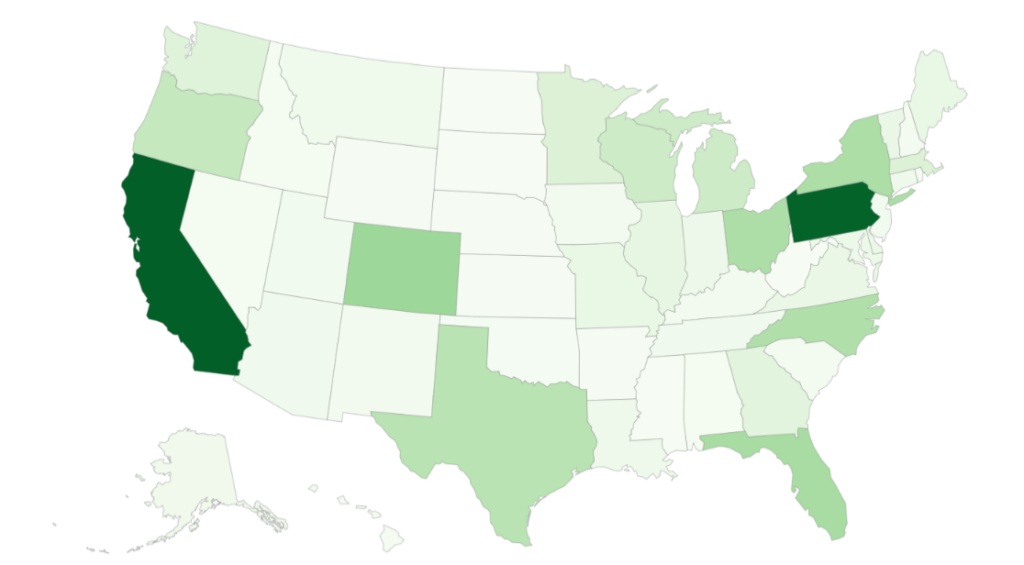
Between 2016 and 2018, Pennsylvania had been number one in the production of craft beer. This was in large part thanks to Yuengling being the oldest and one of the largest independent breweries in the US. However, in 2019 California produced 57 thousand more barrels of craft beer than PA. Both of these two states combine to produce over 27% of all craft beer in the United States. In fact, Colorado – the next state in the list – creates less than half of what either CA or PA does.
Top Five States
| State | Barrels |
|---|---|
| California | 3,664,080 |
| Pennsylvania | 3,606,444 |
| Colorado | 1,529,613 |
| Florida | 1,401,142 |
| New York | 1,347,435 |
Bottom Five States
| State | Barrels |
|---|---|
| South Dakota | 20,843 |
| North Dakota | 21,225 |
| West Virginia | 22,964 |
| Mississippi | 25,257 |
| District of Columbia | 35,857 |
Total Breweries
In the 9 years covered by this map, the United States added a whopping 6,265 craft breweries. Most of the additions were in California, New York and Pennsylvania, which accounted for nearly 21% of all new breweries. In 2011, there were 0.56 breweries per 1000 miles in the US. In 2019, that density exploded to 2.33.
The states at the bottom of this list is not surprising considering they are either remote or have some of the least amount of land mass. Or if you are Hawaii… both.

Top Five States
| State | 2011 | 2019 |
|---|---|---|
| California | 270 | 907 |
| Colorado | 126 | 425 |
| New York | 75 | 423 |
| Washington | 136 | 423 |
| Pennsylvania | 88 | 401 |
Bottom Five States
| State | 2011 | 2019 |
|---|---|---|
| District of Columbia | 6 | 12 |
| Mississippi | 2 | 14 |
| North Dakota | 2 | 22 |
| Hawaii | 7 | 24 |
| Delaware | 7 | 27 |
Note: Statistics for these maps came from the Brewers Association.
